
PEPE coin has been in the spotlight again, after market reports indicate a breakout above the resistance zone. This has led to an increase in community discussions about PEPE’s short-term momentum, regarding whether PEPE coin price can keep the bullish momentum alive in a volatile meme coin market.
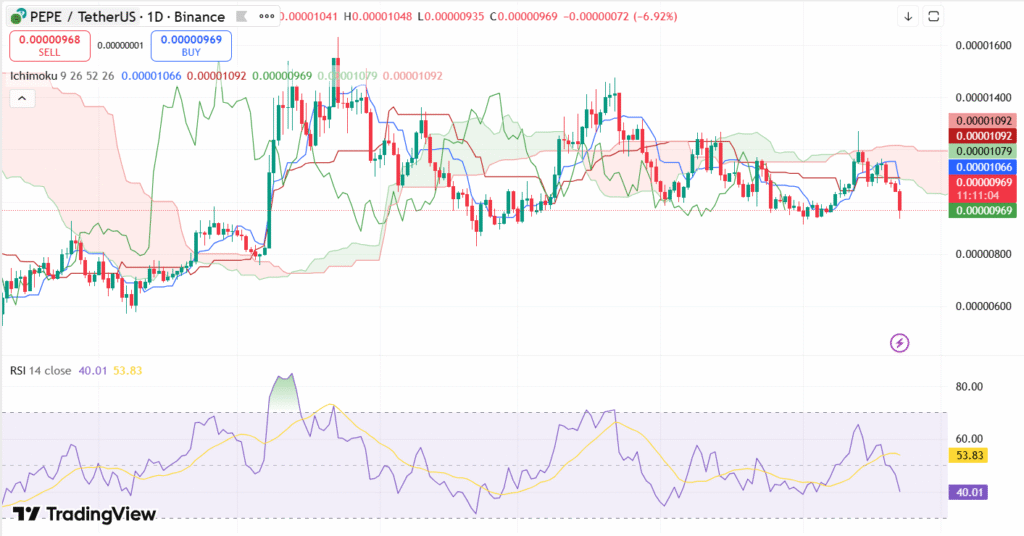
From a technical point, the Ichimoku Cloud indicator gives us some helpful insights. PEPE crypto price is currently testing the lower band of the cloud, which is a dynamic zone acting as both support and resistance. On the other hand, the thin cloud ahead indicates a volatile nature. The buyers need to reclaim the upper cloud edge/resistance again near $0.00001200 USD for a bullish continuation. If PEPE does not close above this price level, it’s likely that bearish price action may continue and selling pressure may increase, resulting in a consolidation or a pullback into a bearish price level highlighted by the red clouds in the chart.
The Relative Strength Index (RSI) is another important price indicator. Currently, the RSI is approximately 40.01, while it is slightly in bearish momentum, yet not oversold zone. This indicates that sellers still exist , and there is still room for buyers to step in & defend the support levels. But a push above the 50 RSI zone would indicate a bullish price formation ahead.
To conclude, PEPE coin currently appears to be at a very important technical level. Traders are keen to see whether the Ichimoku resistance and the RSI positioning indicate whether the breakout represents a continuation of a sustained rally, or it leads into a further price consolidation ahead.